

London IP week 2020 is in full swing.
Coronavirus and its effects on global GDP, trade, demand and the oil price are unsurprisingly a major talking point.
So what does real-time seaborne trade flow data show?
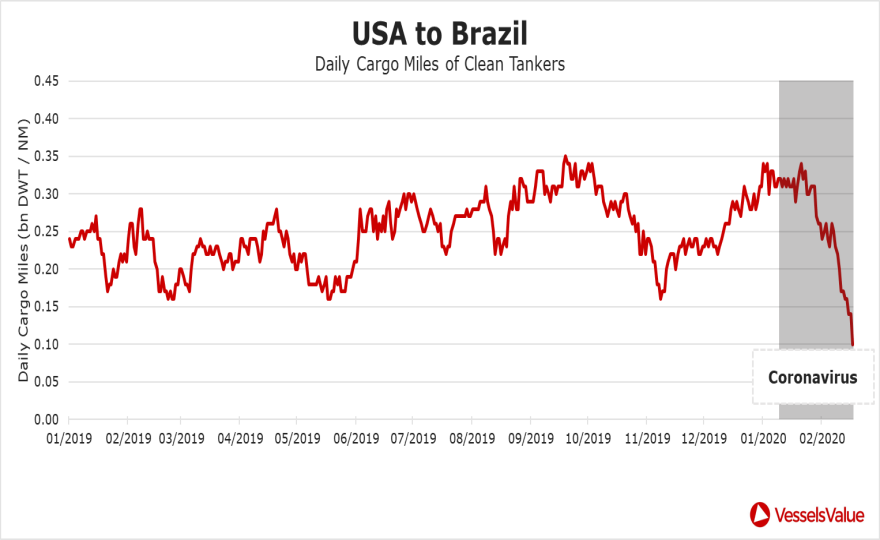
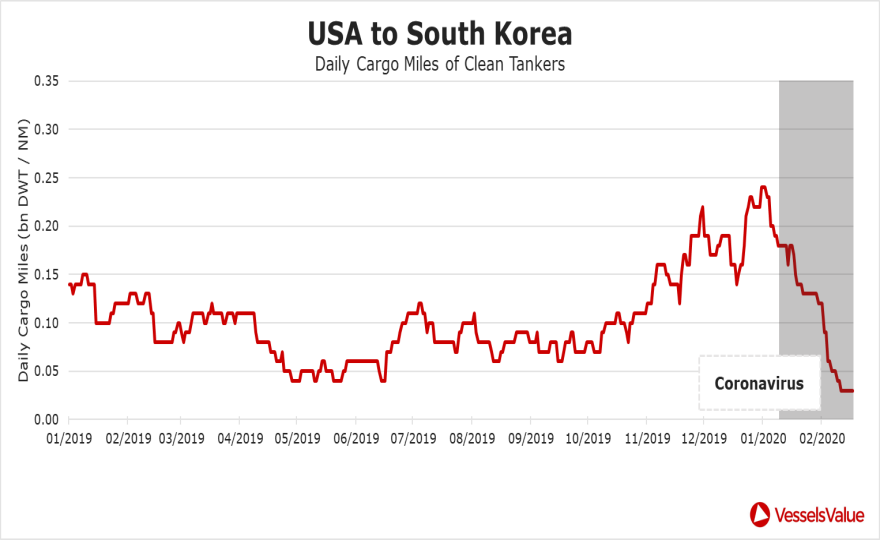
The data covers the laden movements of clean tankers (MR1s to LR3s) measured on ton miles to take into account distances as well as volumes.
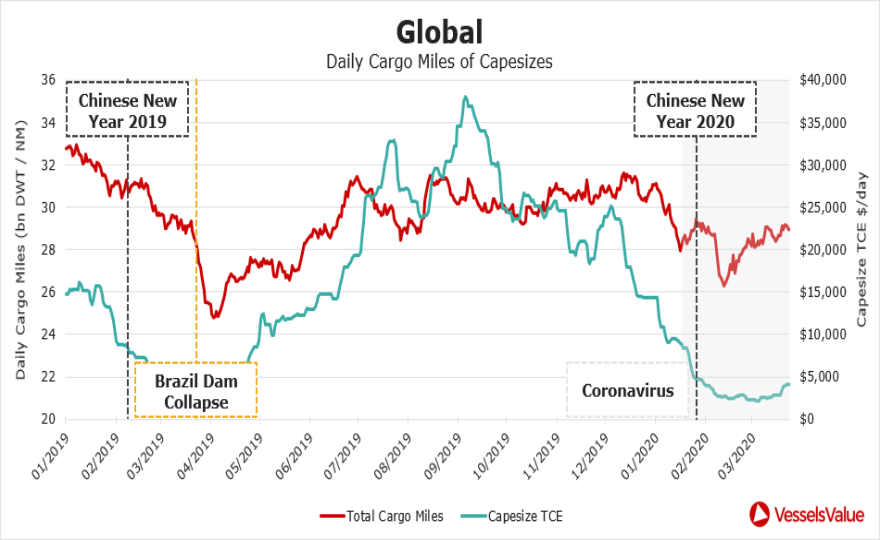
A clear recent downward effect can be seen since the all-time high of clean tanker ton miles hit on 31st December 2019. Of course, Chinese New Year has had its usual negative effect, but unlike previous years, there has not been the bounce back and ton miles have stayed at near 12 month lows.
Diving a little into the underlying trades, by looking at country to country ton miles, shows some interesting trends. The charts below shows the significant drop off in ton miles from US to Mexico, Brazil and South Korea. These trades should not be too affected by Coronavirus (apart from very recently in South Korea), but the data clearly shows the knock on and interrelated effects on global trade flows.
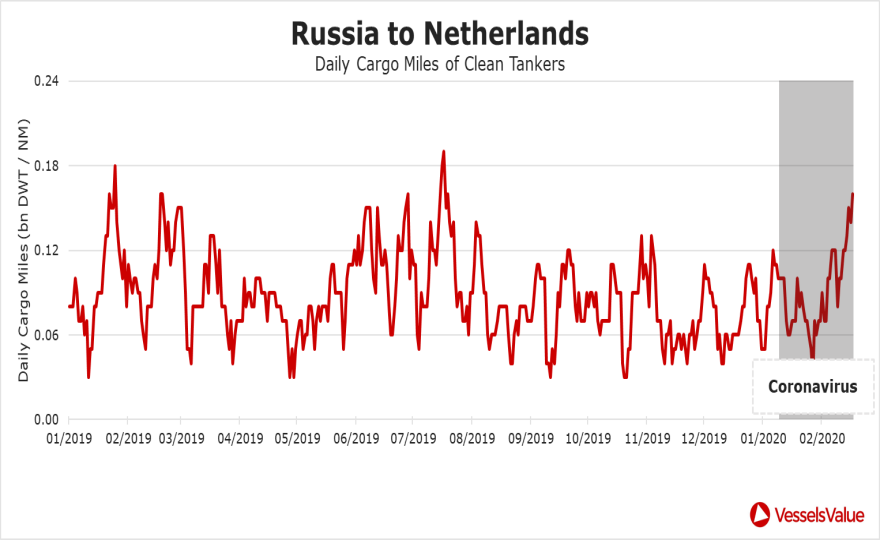
In contrast, we are seeing some trades rising significantly. See for example the chart below of the recent fast rise Russia to Netherlands ton miles.
Of course, seaborne trade of refined products is complex and interlinked, and the data in this article only scratches the surface. Contact us for more data covering other trades, ton miles, cargo volumes and more.